The pressure is on marketers to deliver profitable results. But are your marketing initiatives positively impacting your bottom line without incurring considerable expenses? If you’re unsure, it’s time to perform a profit and loss analysis.
As well as communicating key financial insights — such as where your resources are being spent and where your income is generated — a profit and loss analysis helps you assess marketing performance and uncover profitable opportunities.
Before we discuss how to perform a marketing profit and loss analysis, let’s explore what it is and why it’s so important.
Significance of P&L analysis in assessing marketing performance
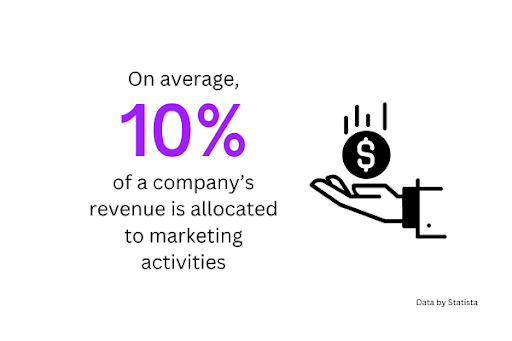
In a world where just over 10% of a company’s revenue is allocated to marketing, every cent counts. A profit and loss (P&L) analysis involves scrutinizing your P&L statements to derive insights that help you optimize your marketing initiatives to maximize profit.
But what is a P&L statement? A P&L statement is a financial report that outlines your company’s earnings and expenses over a given timeframe, such as a month, quarter, or year.
Aside from telling you the obvious — whether you’ve made a profit or a loss — a marketing P&L statement can be used to gain insights into the profitability of marketing initiatives against the backdrop of your company’s financial health.
Clearly see which marketing activities consume the most funds and generate the most revenue. For example, are you spending too much on low-performing traditional ad campaigns? Should you be reallocating more of your budget toward email or social media strategies?
These questions — and many more — can be answered through P&L analysis.
Components of a profit and loss statement
P&L statements comprise the following seven essential components:
- Revenue
Revenue tells you the total volume of capital that you’ve accrued during a specific timeframe, such as the past year, quarter, or month. - Cost of goods sold (COGS)
Cost of goods sold (COGS) refers to the direct expenses incurred by your company as a result of producing and delivering goods or services. Direct expenses include materials, product development, labor, and shipping costs.. - Gross profit
Gross profit is the profit you’ve made after deducting the cost of producing and selling your product (i.e., the COGS). To calculate gross profit, deduct the cost of goods sold from your total revenue.Gross profit doesn’t consider indirect expenses. So, it isn’t a full representation of your total profit. That said, gross profit is a good indicator of how cost-effectively you’re utilizing resources such as materials and labor. - Operating expenses
Operating expenses refer to your indirect costs. Along with rent and utilities, they include marketing, payroll, office equipment, legal fees, inventory costs, and more. - Operating income
Operating income is the total profit accrued once both direct and indirect expenses have been subtracted. So, it involves taking your gross profit (which is your total revenue minus COGS) and deducting operating expenses (rent, office supplies, etc).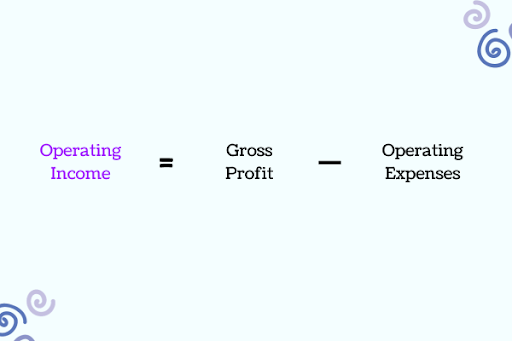
Image created by writer - Other income and expenses
Some types of business income and expenses aren’t covered under COGS and operating expenses. These include taxes and interest (paid and recovered) as well as one-time costs such as impairment charges and investments. - Net income
Net income refers to your total income once all of your income and expenses (COGS, operational, miscellaneous, etc.,) have been deducted. It’s the most comprehensive, accurate representation of your company’s profitability and appears on the bottom line of your P&L statement.
KPIs for P&L analysis to measure marketing success
Unlike traditional P&L analysis, marketing P&L uses marketing-related KPIs to measure the performance of initiatives. Here are the main KPIs you’ll need:
- Return on investment (ROI)
ROI measures how much money was spent on a marketing initiative against the revenue that the initiative generated. It’s used to justify marketing spend and make sure that the resources being put into campaigns are recouped in revenue. - Customer acquisition costs (CAC)
CAC tells you how much every new customer costs to obtain on average. If CAC is too high, it burns through resources and limits profit potential. It’s calculated by dividing the total marketing and sales expenses by the number of new customers. - Customer lifetime value (CLV)
CLV predicts the total net profit generated from an individual customer over their entire relationship with your company. It’s a useful metric for estimating revenue sustainability based on projected income. - Revenue growth rate
The revenue growth rate calculates the percentage increase in revenue compared to a previous period’s revenue. It aids P&L analysis by telling you how quickly (or stagnantly) your business is growing, allowing you to make financial adjustments. - Lead conversion rate
Lead conversion rate directly measures how many market-qualified leads go on to convert into paying customers. It’s one of the most important KPIs for evaluating how effectively marketing campaigns, channels, and touchpoints drive profit.
Best practices in conducting profit and loss analysis
To extract maximum value from profit and loss analysis, here are some best practices for you and your marketing team to follow:
Categorize expenses to understand cost structures
Separate your marketing expenses into categories to better understand your wider cost structures and strategically optimize budgets in response.
For example, if a specific activity absorbs 50% of your total budget but only generates 20% of your high-quality leads, chances are it has a low ROI. So, you might decide to reallocate your funds toward a different activity.
Some of the main marketing expenses categories include:
- Digital advertising (e.g., social media).
- Traditional advertising (e.g., newspaper and magazine ads).
- Events and trade shows.
- Marketing technologies.
- Salaries and benefits of marketing employees.
- Marketing overheads.
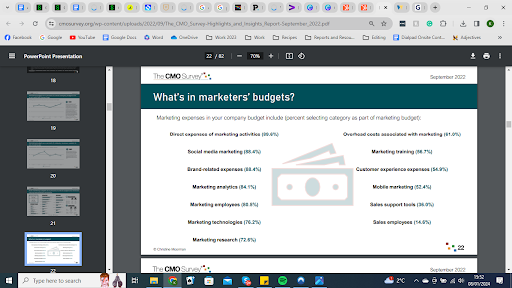
Here’s a breakdown of typical marketing expenses included in a company’s budget according to the latest CMO survey:
Implement marketing attribution models for enhanced insights
Marketing attribution allows you to credit every purchase to a specific marketing activity. This aids P&L analysis by highlighting which campaigns and channels are responsible for driving conversions, in turn informing strategic decisions.
There are different marketing attribution models that you can use to identify the touchpoints driving conversions across your entire customer journey.
First touch attribution: Credits the first click or interaction made by a potential customer at the very top of the funnel.
Last touch attribution: Credits the last click or interaction made by a customer before a purchase is made.
Multi-touch attribution: Credits all of the touchpoints that a customer engages with to the point of conversion. Depending on the type of multi-touch attribution model used (linear, U-shaped, W-shaped, etc), each touchpoint might be assigned different weights of value.
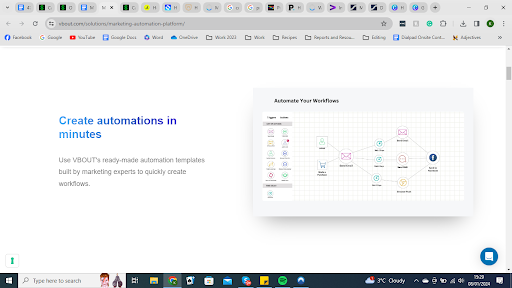
Streamline data entry and reporting through automation
Marketing automation platforms have changed the game for marketing teams. From streamlining complex workflows to facilitating cross-channel automation, they’re an invaluable tool for maximizing productivity.
In the same vein, financial automation tools are equally as useful.
An effective P&L analysis relies on accurate financial reporting. With manual data entry so prone to human error, turning to automation tools can maximize your insights’ accuracy, reliability, speed, and value…
Accounting solutions can capture data from financial documents, such as invoices, receipts, and bank statements, and compile this data into reports for instant, actionable insights. So, you can turn out quarterly — or even monthly — profit loss statements to keep your finger on the pulse of your financial health.
Automation can be implemented at various levels to aid marketing P&L analysis. Take software for cash flow management, for example. It pulls data from different sources to give you real-time cash flow visibility. So, you can immediately verify whether you’re generating cash in alignment with predefined budgets and profit expectations.
If you spot any cash flow issues, they can be resolved way before the release of your P&L statement, helping you avoid any nasty surprises.
Upskill marketing teams with financial expertise
It’s not unusual for marketing teams to get so absorbed in the creative development of campaigns that financial viability becomes an afterthought. Equipping your marketing team with financial expertise empowers them to see the value in financial data.
In turn, marketing teams can hone their productivity and plan more strategically in line with budget limitations.
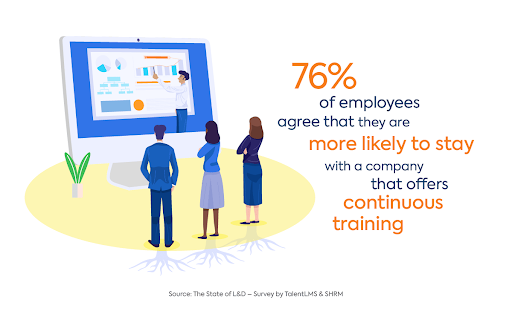
As an added benefit, upskilling improves employee job satisfaction and retention. 76% of employees are more likely to stay with a company that offers continuous training. So, even more reason to invest in learning and development!
Foster collaboration between marketing and other departments
Marketing needs to work with other departments, such as finance, sales, and logistics, to improve decision-making and secure departmental buy-in.
A marketing and finance collaboration aligns the needs of both parties. Marketers can use financial guidance to optimize their resources for profit, while financial teams can be presented with the numbers they need to confidently allocate budgets.
Similarly, collaboration between marketing and logistics empowers marketers to quickly respond to fluctuating customer spending habits and supply chain issues. By granting access to purchase order tracking software, teams can utilize the data to provide more value to P&L analysis (e.g., real-time and projected inventory levels, pricing structures, and customer lifetime values).
To foster cross-department collaboration, you can:
- Build a culture of transparency and information-sharing.
- Use communication technologies.
- Break down data silos using centralized systems.
- Encourage open feedback.
Key takeaway
Financial analysis plays a key role in assessing marketing performance. It provides a big-picture view of how your marketing initiatives contribute to bottom-line health. Perform an in-depth profit and loss analysis to evaluate high-performing and low-performing activities, optimize your resources, and identify profitable opportunities.
Remember to:
- Categorize your expenses.
- Track essential marketing metrics.
- Streamline the process using automation.
- Foster an environment of continuous learning, knowledge-sharing, and collaboration.
Don’t forget to share this article