There should be little doubt that Facebook offers immense digital marketing capabilities. After all, social media advertising can yield impressive results, hence its recent surge in popularity among marketing agencies. Whether it’s an eCommerce website strategy or otherwise, Facebook’s leading status as a platform can offer a vast potential audience. However, gauging such techniques’ performance is often ambiguous, and not all metrics are created equal. As such, this article will cover the most vital Facebook metrics every brand needs to track to ensure actionable insights.
Why Facebook?
Initially, let us support the claim of Facebook’s value to digital marketing with some data. While it should be self-evident that it’s the largest social media platform today, the numbers are staggering.
According to Statista, Facebook saw over 2.7 billion monthly active users in the second quarter of 2020. What’s more, they project this upward trend to continue. Thus, this astounding potential audience pool naturally allures digital marketers, at times due to size alone. Digital marketing agencies can, in turn, only support social media strategies themselves, considering their surge in the digital age.
Tracking digital marketing and social media metrics: automation and agencies
However, this wealth of customers creates vast customer data and analytics to track. Digital marketing strategies are already large enough in scope; adding a social media front expands them too much for many to analyze efficiently. As such, it’s always sound advice to employ automation and technology and consult the professionals to ensure continued success.
Facebook metrics to track: posts and video
With the above in mind, it should be clear that there are many valuable social media metrics to track. Such metrics provide invaluable insights into your digital marketing efforts and future-proof your campaigns should you change marketing agencies.
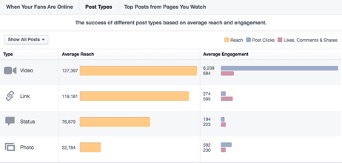
In terms of posts and videos, let us explore five main Facebook metrics every brand needs to track.
1. Reach
his is among the most valuable metrics to consider, without a doubt. Reach gauges how many people actually see your content through both organic and paid efforts.
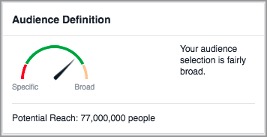
In essence, reach lets you measure your content’s visibility and effectiveness – alongside impressions and engagement, of course. While organic reach seems to have declined in recent years, it’s still an actionable metric that helps inform content strategies.
2. Impressions
Unlike reach, which measures how many people see your content, impressions assess how many times people see your content. This vital distinction hinges on the effect of impressions; how often a single person sees the same content drives sales.
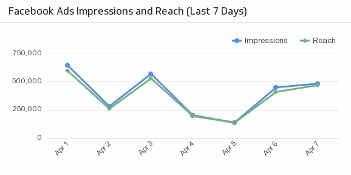
Continuous exposure to content may underline a “viral” post status or suggest significant organic engagement. Either way, impression metrics are just as important as reach metrics when determining strategy effectiveness.
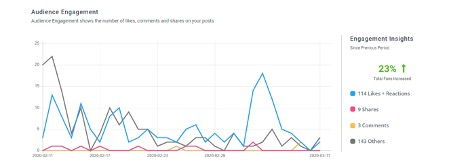
3. Engagement
Finally, engagement completes this trio of post effectiveness. Engagement gauges how often audiences engage with your content in various ways:
- Liking and reacting
- Commenting
- Sharing
- Clicking a link
This metric is the final arbiter of how effective your content is at inciting engagement. In turn, it can inform your strategies as you try to fine-tune them. Furthermore, as Hootsuite notes, engagement is a vital part of Facebook’s algorithm as well. Thus, increasing engagement can also improve your reach and impressions, as your content sends it better social signals.
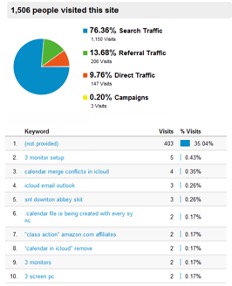
4. Referral traffic
While the above trio of metrics measures your content’s effectiveness on Facebook, your final goal should be to gain referral traffic. That’s what referral traffic metrics track; how often it attracts traffic to your website, and thus down your sales funnel.
Fortunately, Facebook Insights, Google Analytics, and other such tools can help track these metrics. However, should you wish to consolidate them and automate relevant reports, you may want to consult professional digital marketing agencies.
5. Video engagement and retention
Finally, video content on Facebook sees a surge in popularity as well. That’s in no small part because audiences react very well to visually stimulating content, as Instagram and Pinterest can prove. In much the same way as Facebook posts, video content also comes with invaluable metrics, namely, engagement and retention.
Those shed light on your video content’s performance, so naturally, they’re among the Facebook metrics every brand needs to track. Page Insights can inform you of how users engage with your video content, including how long they watch.
Facebook metrics to track: ads
Finally, Facebook content aside, Facebook ads also have a plethora of metrics you need to track. Fortunately, technology offers abundant ad automation options, from re-engagement automation to customer segmentation for personalized ad targeting. However, knowing which solutions to employ hinges on having some vital ad metrics at hand.
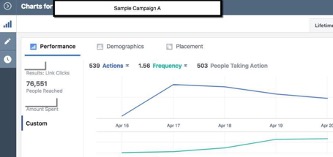
1. Ad frequency and impressions
Identically to content impressions, ad impressions inform you on ad views. On the other hand, Ad frequency tells you how frequently the same people saw the same ad. Of course, the higher both are, the better.
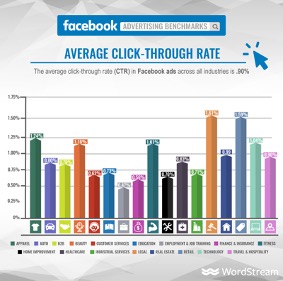
2. Click-through Rate (CTR)
CTR informs you of how many people clicked through your ad and possibly converted to leads or referral traffic. This is an invaluable, actionable Facebook metric every brand needs to track since it directly gauges ad effectiveness.
According to Wordstream, the average CTR across all industries is approximately 0.9%. Should your CTR fall lower than your industry’s average, it may be time to review your ad strategy.
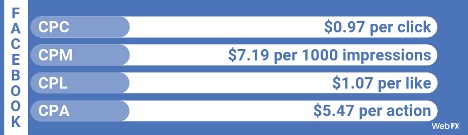
3. Cost per Click (CPC)
CPC, instead, measures the total cost for each click your CTR identifies. The higher your CTR, of course, the lower your CPC should be. In turn, an optimal CPC ensures a better CPM. Keep in mind that, according to the research above, the average Facebook Ad CPC across all industries is $1.68.
4. Cost per Action (CPA)
CPA is an equally vital metric, as it measures the cost for each desirable action. However, this isn’t purely sales-related; desirable actions can vary depending on your campaign’s end goal.
According to Webfx, the average CPA across all industries is $5.47.
5. Conversion rate (CVR)
Finally, conversion rate gauges how much of your click-through rate leads to conversions and sales. According to the research above, the average CVR across all industries is 9.11% – so tracking it is vital. This metric, combined with CPC and CPA, can let you get a clear understanding of how your Facebook ads perform.
Author bio:
Arthur Clarkson is a freelance web designer and copywriter, as well as an avid digital marketing enthusiast. He frequently contributes content to Digital Dot, where he discusses SEO, PPC marketing, and other digital marketing endeavors.
Don’t forget to share this article